
September 3, 2026 · Michael Lynn
A LanceDB Table Can Hold 2.65 GB of Video While a Search Over It Reads None
The bytes a search touches and the bytes a table holds live in different files. LanceScope measures both, from Lance's own IO counters, and puts the number next to whatever you just did.
Searching video has been sitting in the back of my head for years. At MongoDB I spent a
lot of time on vector search, and the pattern I kept building and kept teaching was
always the same shape underneath. You break the media into pieces, embed the pieces,
put the vectors in the database, and leave the actual bytes somewhere else. Object
storage, a CDN, a bucket with a naming convention someone documented once. It works
fine. It also means you're running two systems that have to agree about what a row is,
and every so often they don't.
Then a friend started telling me about LanceDB. The thing he described was that the
media and the index could be the same table, and that searching it wouldn't read the
media. I didn't believe him. Not in a hostile way, but the claim ran against everything
I'd assumed about how storage works, and I've heard enough database pitches to know
that "and it's fast" usually has a footnote attached.
So I went and read the format. Blob V2 columns keep heavy payloads in separate
.blob
files and hand back a lazy handle instead of the bytes, which means a scan over the
table genuinely never opens them. That's not a trick or a cache warming up. It's how
the files are laid out. The more I poked at it the better it got, and after a couple of
evenings I was far enough in that I wanted to build something on it rather than just
read about it.What I built was a demo I called Ctrl-F for Video. You type "a diagram with boxes and
arrows," you get back actual frames from a corpus of recorded talks, you click one, and
the video starts playing at that exact second. It worked. What I couldn't do was prove
the interesting part. When I told people the search had never touched a single video
byte, they'd nod politely and I could tell they'd filed it under "sure, in theory."
Everything I had for looking at a Lance dataset would happily report ten rows in a
millisecond and stop there.
So I put a byte meter along the bottom of the demo, and building the meter turned out
to be more interesting than the demo. That's LanceScope.
The number that surprised me
On my 16-talk corpus, the
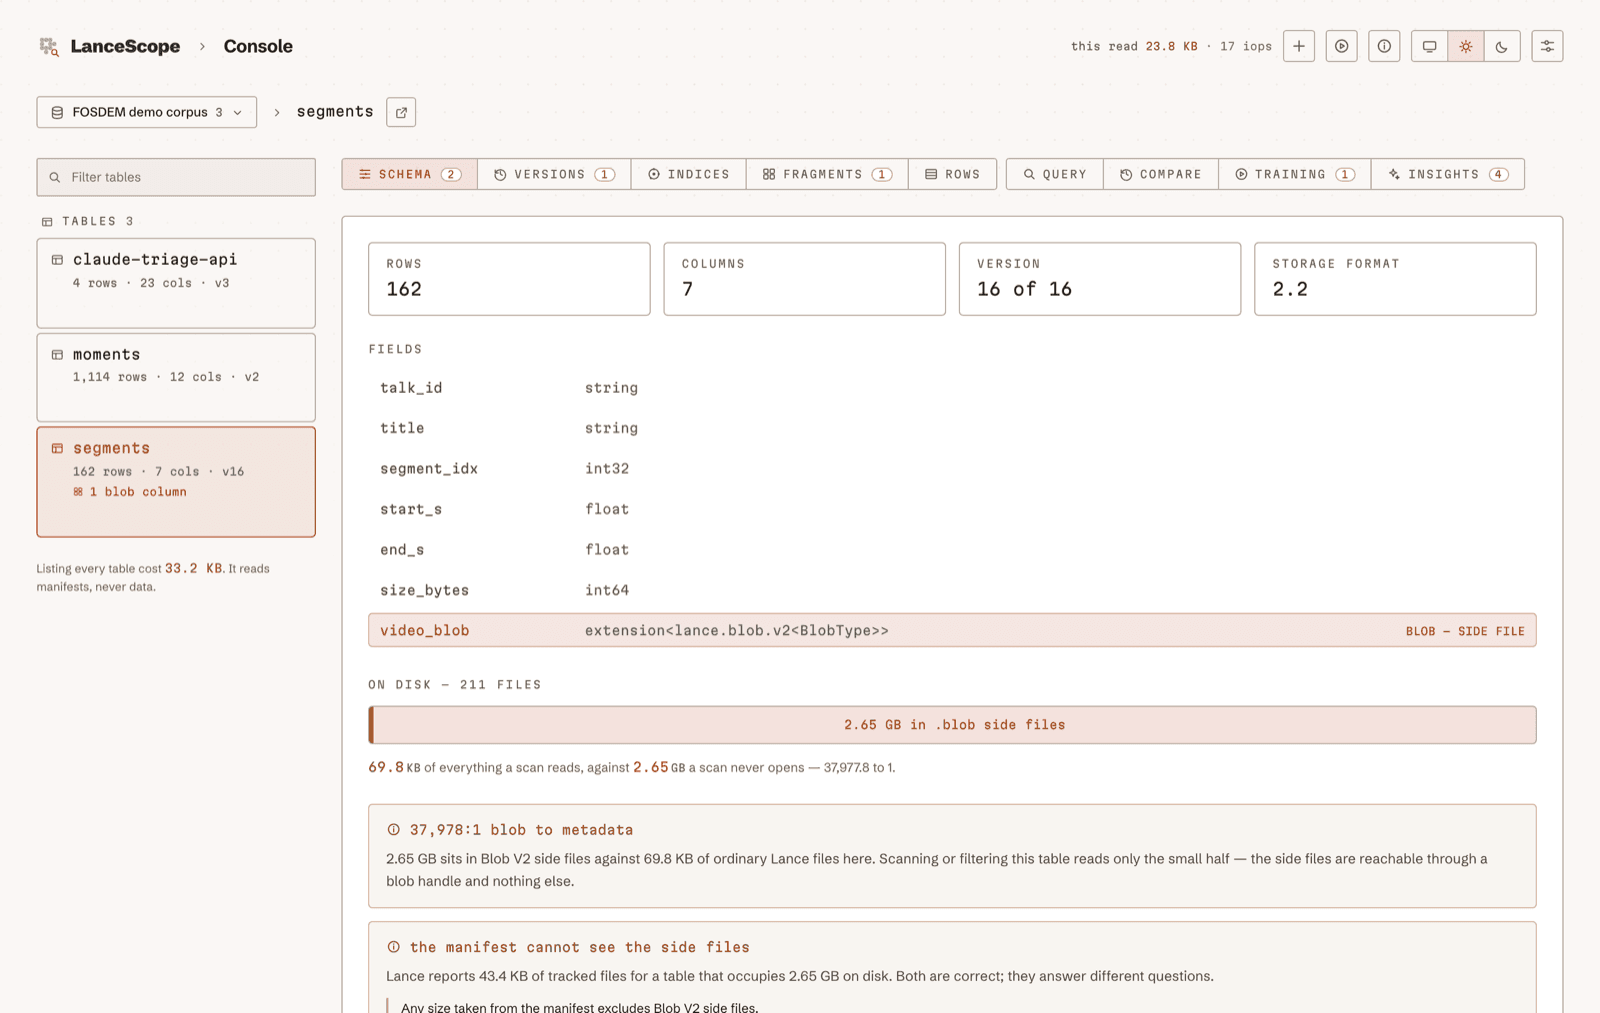
segments table holds 2.65 GB of video. Everything a search
over it actually reads adds up to 20.0 MB. That's a ratio of 132 to 1, and it isn't a
sampling artifact or an estimate. The video bytes simply are not in the files a search
opens. Lance's Blob V2 columns keep heavy payloads in separate .blob side files and
hand back a lazy handle instead.Here's the part I keep coming back to. A vector search over every moment in that
corpus reads 3.45 MB of index and zero bytes of video. Not a small amount of video.
Zero. Run the same question as full-text search over the transcripts and it drops to
0.11 MB, because that column has an inverted index and the vector column doesn't.
Thirty-something times cheaper for reasons that have nothing to do with the query and
everything to do with what I built into the table months earlier.
Opening a blob handle costs 2,722 bytes. Starting playback on a cold segment costs
about 17 MB. Seeking again inside that same segment costs exactly 262,144 bytes,
byte-exact, every time.
Those are all measurements, re-run by
make verify against the corpus. I'd been
saying "search doesn't read the video" for weeks with nothing behind it but the fact
that it felt fast.Two true numbers that disagree
The thing that convinced me this needed to be a real tool rather than a widget in a
demo was watching Lance's own bookkeeping contradict itself.
Ask Lance how big the
segments table is, through tracked_files(), and it reports
43,424 bytes. Walk the directory yourself and it's 2.65 GB. Neither answer is wrong.
tracked_files() doesn't list .blob paths, so the manifest genuinely cannot see the
side files where the video lives. Lance says as much in its own API docs — Blob V2
payloads live in separate files and aren't counted.Which number you want depends on whether you're asking what a query will cost or what
the storage bill will say. Those are different questions and I'd been sloppily
treating them as one. LanceScope shows both and labels which is which, and honestly
that's the whole thesis of the project sitting in one panel.
What it actually is
There are four ways in, and they all read your data where it already sits.
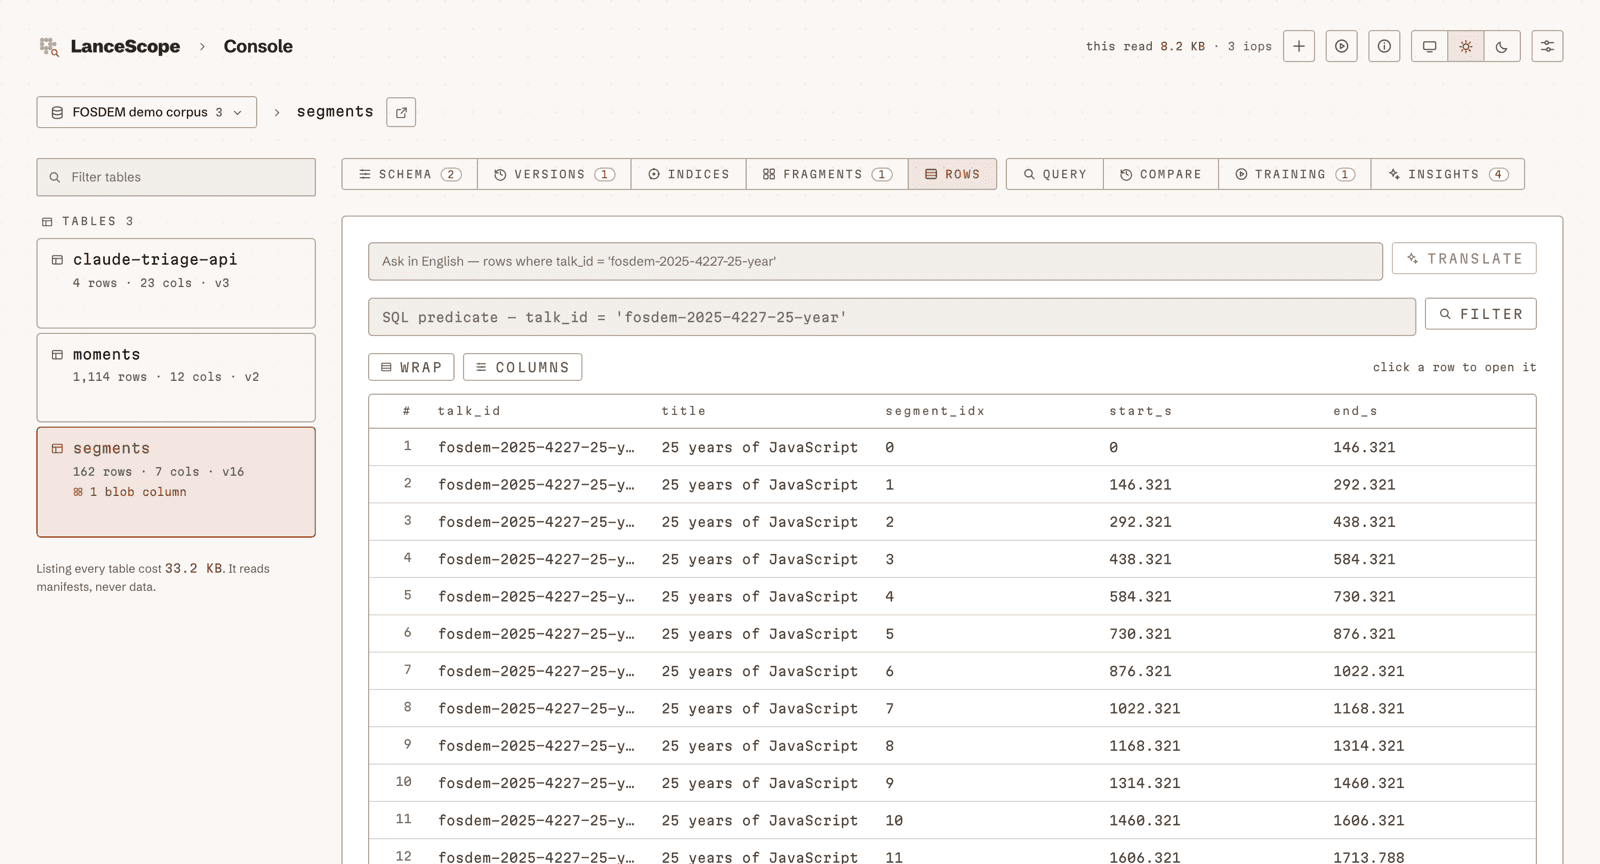
The console is a browser interface for a Lance directory. Schema, versions, indices,
fragments, rows, each panel printing what it spent. Describing 2.65 GB of video costs
23.8 KB and opens none of it. Heavy columns get described from the schema instead of
materialized, so browsing a table full of video stays in kilobytes. You can also paste
a Hugging Face URI and read someone else's dataset over the network — I opened a
937,957-row dataset I'd never touched in about a third of a second for 24,568 bytes
and two IO operations, and nothing downloaded.
There's a CLI for ingestion and scanning, which is what I use to build corpora. There's
an MCP server exposing seven read-only tools, so Claude Code can go look at a database
and come back with the actual manifest numbers instead of a plausible-sounding guess
about what's in there. And there's a macOS app, built by
make app, that bundles the
console and the server into something with no install story at all. No Python, no Node,
no Lance on the target machine. 160 MB as a DMG.The CLI and the console call the same functions in
ingest.core, and the MCP server
wraps the same HTTP routes the console uses. I did that mostly out of self-preservation
after the second time I fixed something in one place and not the other.Findings, without a model anywhere near them
The console also works a few things out on its own. A set of rules runs over the same
manifests the other tabs are reading — seven when I wrote the guide page, ten by the
time the README caught up with me.
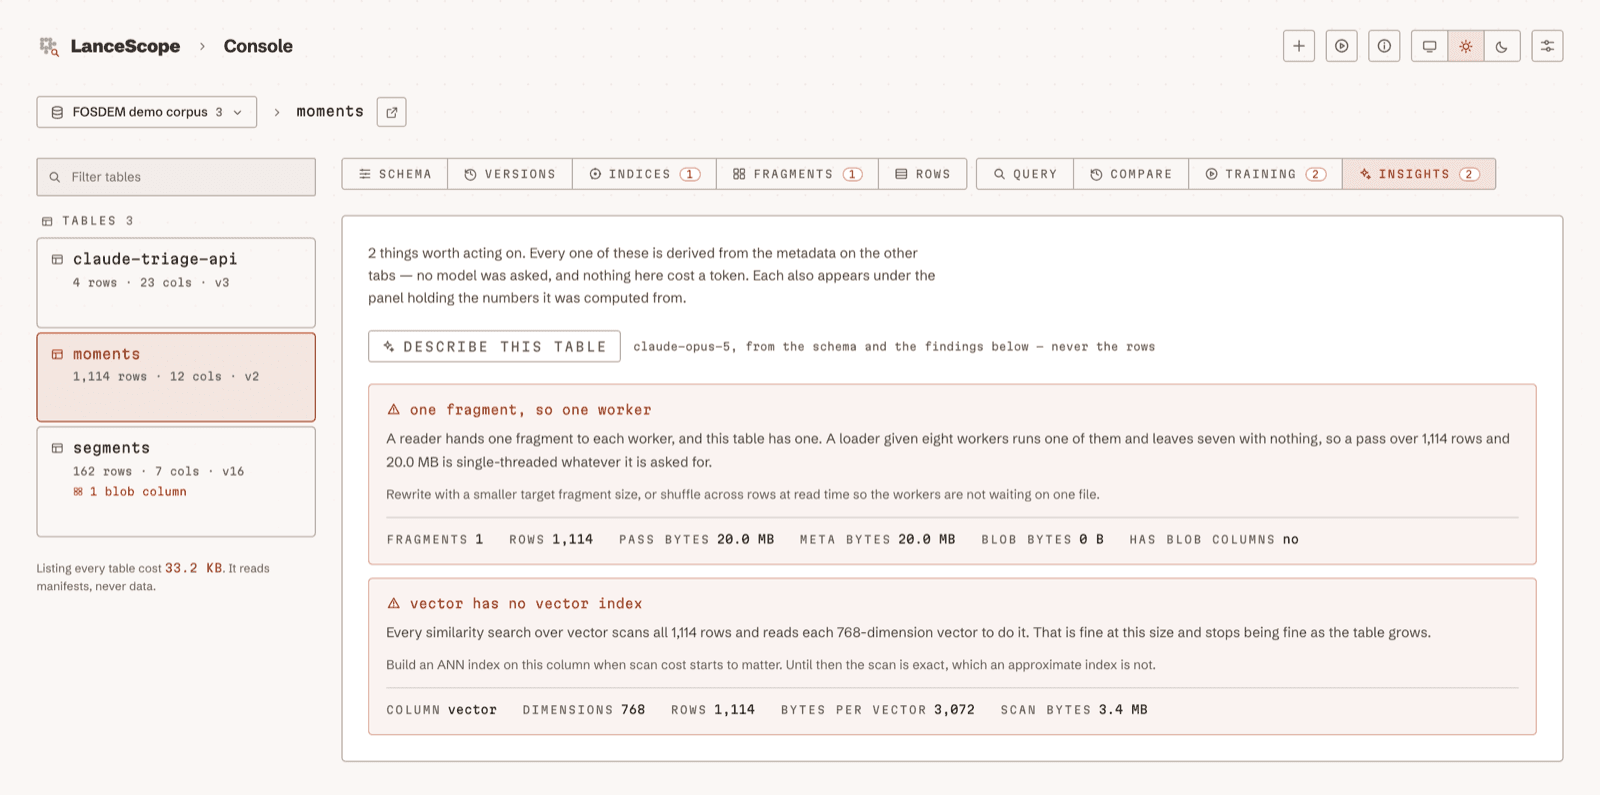
One tells me the
vector column has no index, so every similarity search scans all
1,114 rows and reads each 768-dimension vector to do it. That's fine at 1,114 rows. It
stops being fine somewhere, and the finding gives me the bytes-per-pass so I can figure
out where.My favorite one is the fragment count. The first time I looked,
segments reported
2,651 fragments, which is a genuinely alarming number that would send most people
straight to a compaction job. But 2,644 of those were tombstone files left over from
compaction that had already happened. The real story was seven data fragments and a
pile of debris. If the tool had just said "highly fragmented" I'd have wasted an
afternoon.None of these involve a model. It's arithmetic over metadata Lance already reports.
Language is optional, and it tells you what it cost
You can point LanceScope at a local Ollama model, an Anthropic key, or any
OpenAI-compatible endpoint, and it'll turn a question into a filter or describe a table
in a few sentences. It's off by default and the console is useful without it.
The rule I gave myself is that every response reports the tokens and the dollars it
spent right beside the bytes it read. It would be a strange kind of hypocrisy to build
a tool for making read cost visible and then quietly bill someone for inference in the
corner.
It doesn't write
Reading a table cannot change it. That's checked, not claimed — there's a test that
drives the entire read API and every MCP tool over a real corpus and then verifies that
not one byte on disk moved.
The ingest wizard is the only thing in the project that writes a dataset, and it's
create-only by construction. It refuses a destination that already exists, only appends
into a table it made itself during that same run, and has no reachable path to an
overwrite. The whole write surface is one module and CI fails if a dataset mutation
turns up anywhere else. Deleting is deliberately two separate buttons: one clears a
finished job from the list, a different one deletes the table that job produced. I got
those confused once in an early build.
Try it on your own data
bash code-highlightgit clone https://github.com/mrlynn/lancescope && cd lancescope
make setup
make dev
Open
localhost:3000/console and point it at a directory with .lance tables in it.
You'll need uv and Node 22. If you don't have a database
handy, make ingest LIMIT=8 pulls down a few conference talks and builds the demo
corpus, which gives you moments (keyframes with embeddings) and segments (playable
chunks in Blob V2 columns) to poke at.There's also a container image per Lance reader version, because a Lance reader isn't
universal and a dataset written by one version may need that version to read it. The
tag names the reader.
LanceDB makes some architectures practical that weren't before, and the numbers behind
them are worth looking at directly rather than taking on faith. If you've got a table
somewhere that you think is cheap to search, I'd genuinely like to know what the
meter says when you point it at yours.
LanceScope is Apache-2.0 at
github.com/mrlynn/lancescope. It works with
LanceDB 3.0+ on macOS, Linux, and in containers, and there's a live console at
demo.lancescope.mlynn.dev/console if you'd
rather just click around first.